| Question | Answer | ||
|---|---|---|---|
| How do I set up SUSHI for Elsevier? | You have to fill out an Elsevier request form before you can use SUSHI:https://www.elsevier.com/__data/assets/word_doc/0003/184791/Elsevier-SUSHI-application-form.docx Here are the IP addresses you'll need to fill in: The following IPs/IP ranges must be allowed access to/from your institution. (Note that the IP ranges below are in CIDR notation.) Here is further documentation in the Ex Libris Knowledge Center: | ||
| How do I set up SUSHI for American Mathematical Society? | Use the following values:
| ||
| How do I set up SUSHI for Silverchair-hosted vendors (e.g. AMA, ASME, Duke, GeoScienceWorld) | Log into the Sitemaster admin page and select the COUNTER reports tab. Scroll to the bottom and click on the "How do I use SUSHI to generate COUNTER reports?" link. Enter your Requestor ID, Customer ID, and password as indicated (note that the password you used to log into Sitemaster goes in the Requester Email field).
| ||
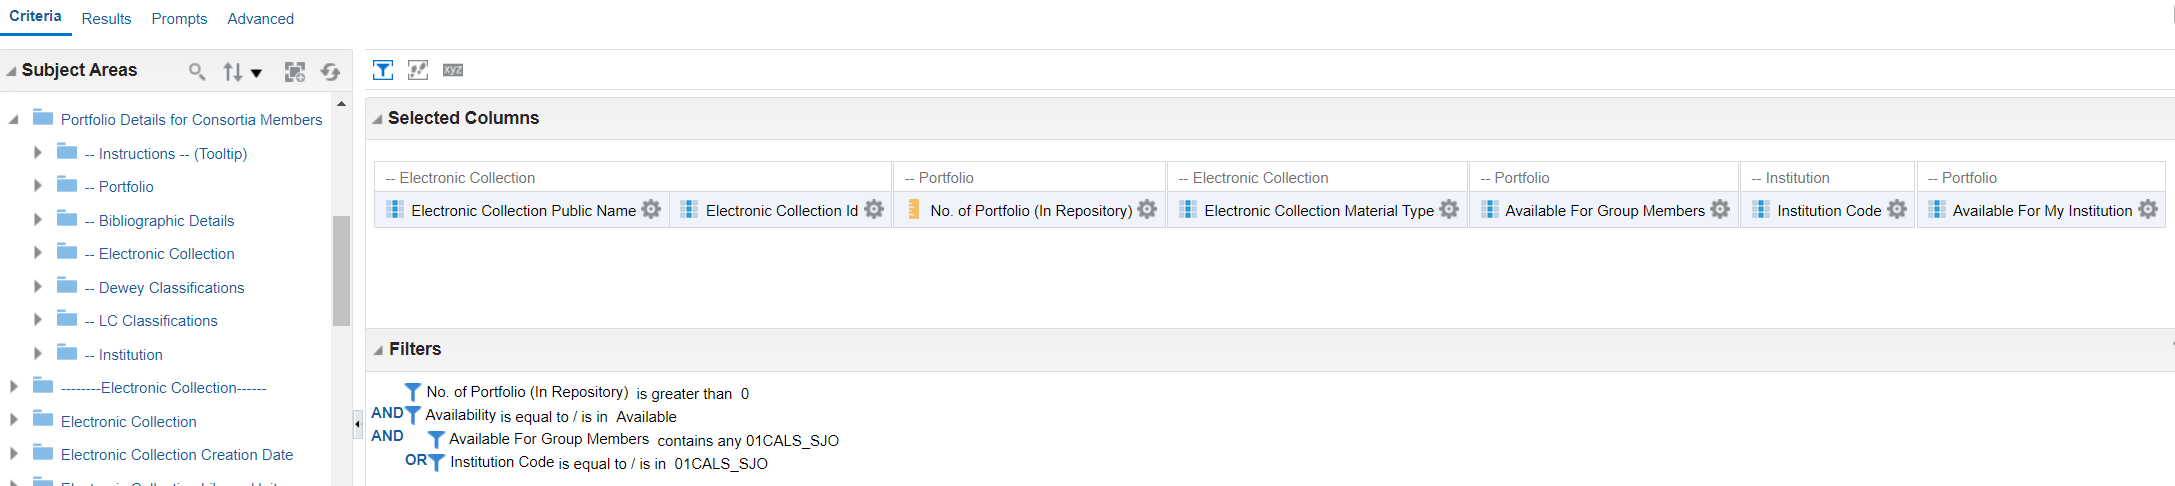
| How do I sort by call # in an Analysis? | Add the Normalized Call Number to your analysis. Click on the menu to sort. You can hide the column using Column Properties > Column Format if you don't want to see it in your reportget a count of all my institution's e-resources including BOTH IZ and NZ-managed collections? | In the past, we've recommended running a report in the Analytics module of Alma Network Zone. However, the report takes too long to run in the Network Zone so the current recommendation is to run the report in your own institution's Alma instance and to use the subfolders of Portfolio Details for Consortia Members folder in the e-inventory. Run the following analytics query. The example is for SJSU. In the last two filters, replace the institution code with your own institution code. (Refer to the list of Alma Institution Codes.) There are different ways to filter this query. The example below shows the report being filtered by Available For Group Members and Institution Code fields. You can also filter the report by using Available For My Institution field instead of using the last two filters in the example.
Note that while most campuses can use Available for Group and Institution Name to filter the report by institution name, campuses such as Chico (CSUC) and Sacramento (CSUS) will need to filter by institution code. If these campuses filter by their institution names, Analytics will return results that incorrectly include similar campus names (e.g. CSUC also returns CSUCI and CSUS also returns CSUSB and CSUSM). (If you'd like to try to run a report in the network zone, the credentials can request from brandon dudley (Unlicensed).) | |
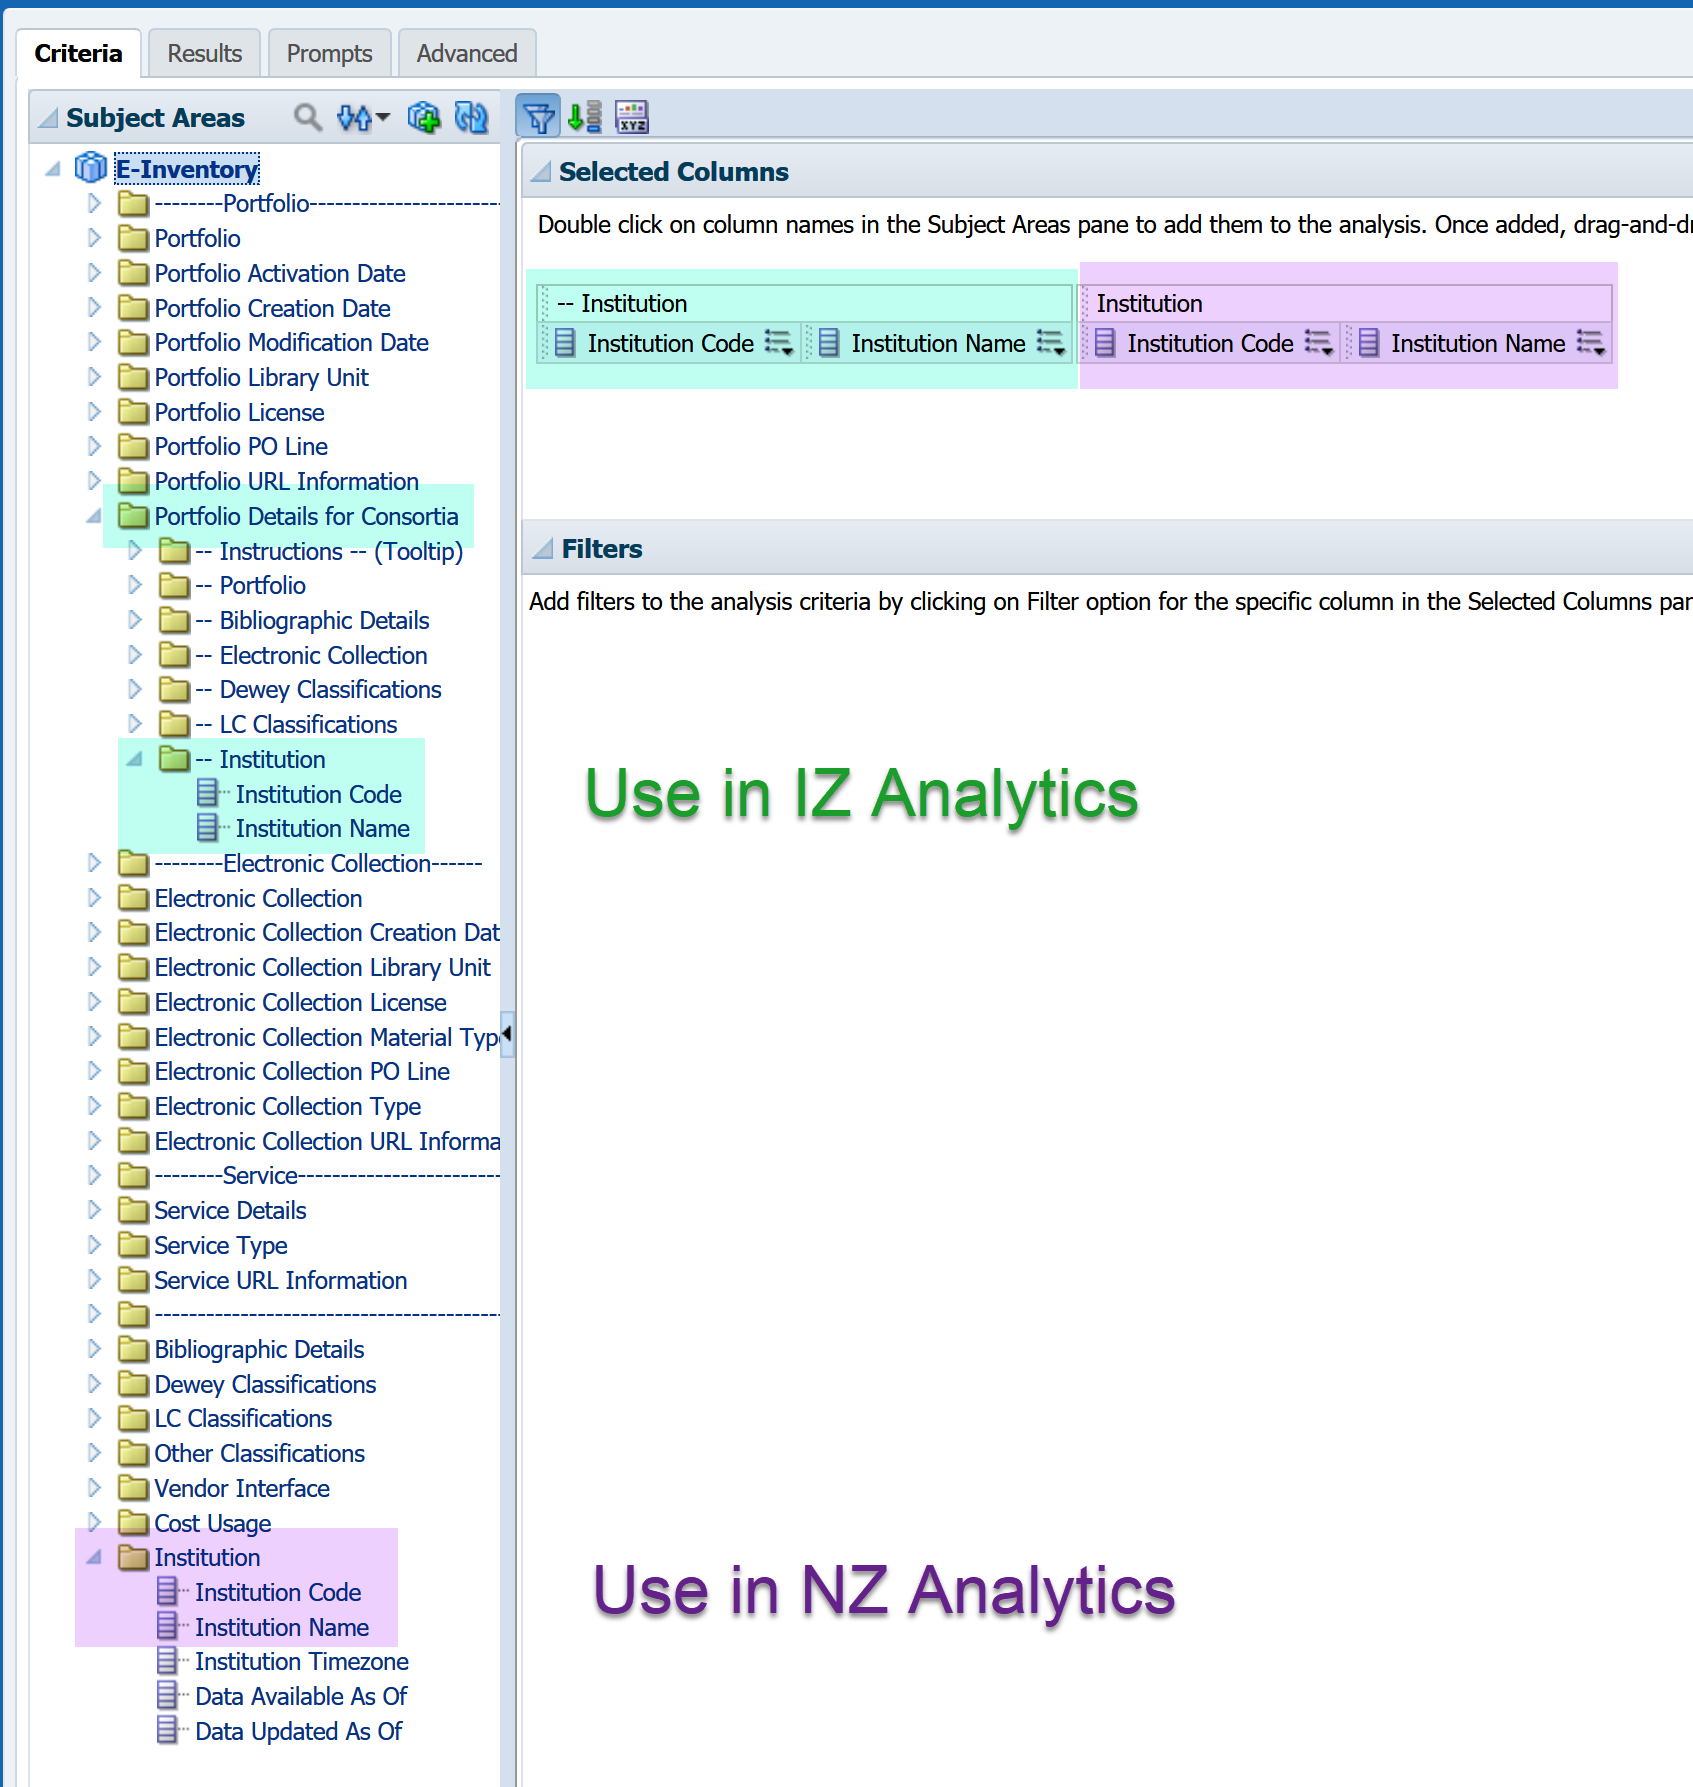
| In the E-inventory SA, which 'Institution Code' do I use for reports in the NZ Analytics vs. reports in the IZ Analytics? | |||
| How do I sort by call # in an Analysis? | Sort by the Normalized Call Number field/column. To use the column for sorting but to hide in in the results, select hide under Column Properties > Column Format. There is a recorded presented called Working with Call Numbers in Analytics which was presented at the April 11, 2019 Technical Services Open Forum by Lauren Magnusun. | ||
| Create a set using the results of an Analytics report | For a video that shows how to create a set using an Analytics report, click here. For a PowerPoint presentation, click here. (This feature became available May 2018.) This feature became available May 2018. Before then, we had to export the results of the Analytics report to create a set. (Refer to instructions on Creating Itemized Set section by uploading a file (step 7.)) | ||
| I want to filter an Analytics report based on a list or a set. | If you have a set, export it to an Excel workbook. If you are starting with a list, the list must have the columns (e.g. barcodes, MMS ID’s, primary ID's of users, etc.) that you want to filter by. Follow steps here to filter the Analytics report based on your list/set. | ||
| Why am I seeing electronic titles in a report in the Physical Items Subject area? | This can be a result of only selecting details from a shared dimension (e.g., Bibliographic Details) in your report. | ||
| Why do I get different results when I run the same report in Fulfillment and Physical Items? | The Fulfillment Subject Area contains information on loans that occurred since the Alma go-live and information on items that are tied to those loans. This subject area also contains some limited information on the last loan prior to migration but will not contain information related to any older loans. This subject area contains no information for items that had no circulation since the Alma go-live. The Physical Items Subject Area contains data related to all physical items in Alma regardless of whether those items have circulated in Alma or in legacy systems. Important: Fulfillment measures (e.g. Loans, Returns, Recalls, Renewals) reliably report only loan data after migration. Physical Items Num of Loans measures contain total loan data before and after migration. Migration note: Mapping may vary by campus, but in general Total Circulation from legacy systems mapped to Physical Items Num of Loans. Last Loan Date mapped to Physical Items Last Loan Date and Fulfillment Loan Date. In Alma, each Loan is associated with a Loan Date, but it is probable that the legacy system only retained a single Last Loan Date for mapping. Be very careful with Loan Date filters in Fulfillment Reports as filtering for dates prior to migration will result in inaccurate reports--only one loan (the one associated with the last loan date) can be reported. Which report should you use? If you need detailed fulfillment data about current processes, including Borrower or Operator details or filtering by date, use Fulfillment. If you need complete or historical loan data or items that have never circulated (e.g. for weeding), use Physical Items. | ||
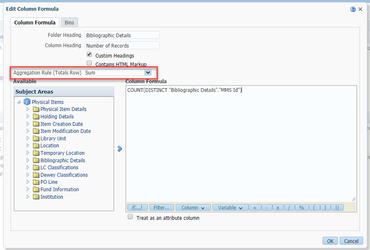
| I created a measure and the results are correct but when I add a total, it's not correct | Any time you create a measure and want to add a total to your report, you need to open the Edit Column Formula window for your created Measure and change the Aggregation Rule (Totals Row) from "Default" to "Sum".
| ||
| I created a measure and now I get an error message when I add a total to my report in the Results tab | If you are seeing this error: RawFile::checkSoftLimit failed because a temporary file exceeds the limit (10240 MB) specified by the NQ_LIMIT_WRITE_FILESIZE environment variable AND You created your own Measurement field by applying a Formula such as CountDistinct to a Descriptive field AND Your report generates the error when you add a total to the results You need to open the Edit Column Formula window for your created Measure and change the Aggregation Rule (Totals Row) from "Default" to "Sum"
| ||
| I added a report/shortcut/folder to the Community folder and now I can't get rid of it | Instructions on how to do this can be seen here: Deleting a Folder, File, or other Object from the Community Folder. Note that the job to delete folders/files/objects from the community folder runs Friday nights. However, as of Jan 2022, these instructions don't seem to work. (The objects do not get deleted or the objects magically reappear.) So for now, please contact Christina Hennessey to delete any objects from the CalState community folder. | ||
| Copy the path to a report | Unfortunately the location/path bar at the top of OBIEE can not be copied to easily share with others. To quickly copy the location: More > Properties > General > Triple-click the Location value to select. | ||
| I got timed out in Analytics and now it's broken. | First, remember to go back to Alma periodically and click on something to keep your Alma session active. If your session times out anyway (i.e. you get no results, you can't get back to the criteria tab, you get the endless spinning wheel or blinking dot icons), you can try to do the following | :but these instructions have not been updated since 2018.
| Analytics
If you closed the tab on Analytics and try to go back, and all you get is the sign-in tab, close that sign-in tab and try again–it will usually work the second time. Note: As of 12/24/2017, Ex Libris has accepted (i.e. moved to "Planned" status) the following from the Idea Exchange: "Extend time before analytics times out | ."
| I want to turn my Analytics report into a set in Alma |
| ||
| I want to turn my set in Alma into an Analytics report | "
*If your set exports a different value such as PID, you can use it the same way–just choose the matching value in Analytics for your filter. | ||
| Are there usage statistics available for this resource? | Here is a non-comprehensive list of resources to tell if usage stats are available:
| ||
| Why am I seeing electronic titles in a report in the Physical Items Subject area? | This can be a result of only selecting details from a shared dimension (e.g., Bibliographic Details) in your report. |
Page Comparison


Manage space
Manage content
Integrations